Venn diagrams are today’s mostly used method for solving syllogisms. With some practice they can be drawn fairly quickly making them a valuable tool in solving syllogisms in timed aptitude tests. Venn diagrams show all possible and hypothetically logical relations between a collection of finite and infinite statements. By means of an overlap between some certain assumptions conclusions can be made using the (in)finite statements. Two examples of the use of Venn diagrams will follow to clarify the above.
Example 1:
- All Canadians are right handed
- All right handed are opticians
- Conclusion: Some opticians are Canadian
To check the validity of this statement first the different terms are appointed.
Predicate: Optician
Middle term: Right handed
We will start with the first out of the two given statements from above. The first thing to do is draw two circles and write the terms Canadian
and Right handed
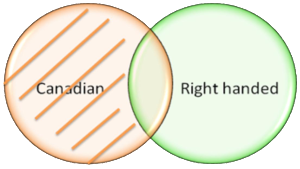
in them. The circle with the word Canadian without the overlap represents only Canadian people, while the part within the overlap with the right handed circle represents all Right handed Canadian people
. Everything outside these two circles represents everything not connected to these two terms. With this one can think of plants, animals, cars but even you and me.
1st Statement
Next, the 1st statement claims: all Canadians are right handed
. Thus this means that all Canadian people outside the overlap of the two circles are notinvolved in this statement, since they are not connected to the term right handed. As a conclusion of that this part of the circle is being shaded.
2nd Statement
Subsequently the 2nd statement is reviewed. According to this statement all right handed are opticians. This statement can be solved by drawing two circles and again shading everything except the overlap in the right handed circle, just as was done with the first statement.
Linking Statements
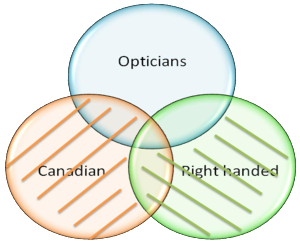
Linking the two statements and the circles together results in the Venn Diagram of figure 2. Here both the first (red) as well as the second (green) statement are displayed. The overlap between Right handed and Optician is clearly shown, even as the absence of one between Canadian and Opticians. Further it can be noticed that there is a small area where all three term are overlapping, a part which is still present.
Now that the Venn diagram is completed, the validity of the conclusion can be checked. The conclusion states: some Opticians are Canadian
. The Venn diagram clearly shows the correctness of this conclusion. Although the overlap area between both orange and green circle is shaded, there is still a small area in the middle where all three terms are present which it not shaded. It is this area that results in the correctness of the conclusion.
This case is characterized as a valid reasoning, since the conclusion can be drawn directly using the Venn diagram. It is however also possible that additional information is needed in order to check the validity of the conclusion. In that case the reasoning is invalid.


